Indicators are an excellent way of enhancing your trading strategy. To remind you, in our series of educational articles posted under the SimpleFX Trading Academy we understand trading strategy as a set of heuristics for efficient entries and exits.
First of all, no indicator works well for every trader, every asset and every timeframe. Most of them don’t work. You need to practice a lot to find the right mix that works for you.
In this post, I will explain what RSI is and how it can be used as a confirmation indicator.
Is it oversold or overbought?
The Relative Strenght Index is 40 years old as it was first introduced by American mechanical engineer and real estate developer J. Welles Wilder Jr. in 1978.
It’s quite straightforward. The indicator oscillates between 0 and 100. When it goes above 70, it means that an asset is overbought and when it goes below 30 – it’s supposed to be a sign its oversold.
RSI can give you information about the trend. If it’s below 30, you could consider buying the security, and if it’s over 70, it may be the time to take a short position. During strong trends, RSI can stay above 70 or below 30 for a longer time.
During a bull’s market, the RSI usually oscillates between 40 and 90, and when it reaches 40-50, it defines the support level. On the other hand, when the bears take over the indicator oscillates between 10 and 60 with 50-60 mark indicating the resistance level.
Now, let’s move to some RSI-related nuances. If an asset goes to a new high or falls to a new low, and an RSI hasn’t confirmed the price movements during that time frame, this is often considered to be a trading signal for reversal.
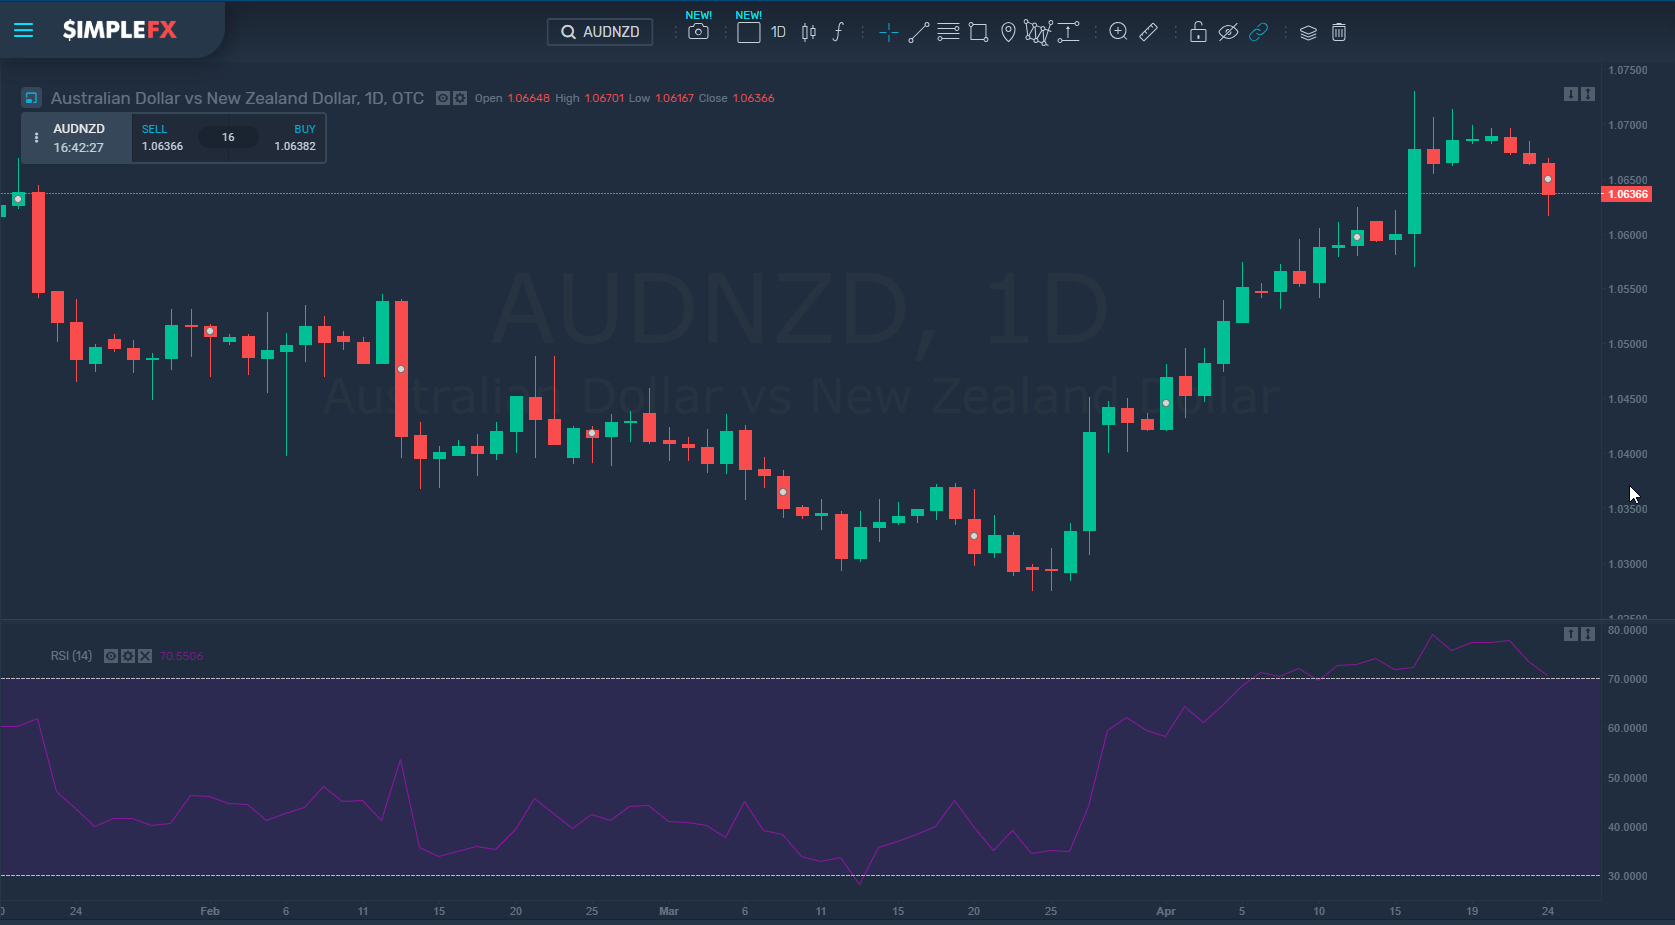
The RSI also has its version of double top and double bottoms. Just take a look at the AUDNZD 1D chart below. If a local high (1) was not exceeded and is followed by a lower high (2), it’s a good idea to take a short position at the point then RSI falls below the local low (3). This is called Failure Swing Top. A reverse situation is called a Failure Swing Bottom.
That’s it from a practical point of view. The RSI signals appear when the indicator goes over 70 levels or under a 30 level. In the oversold levels, you may consider opening a BUY order, and in the overbought levels, you may consider opening a SELL order.
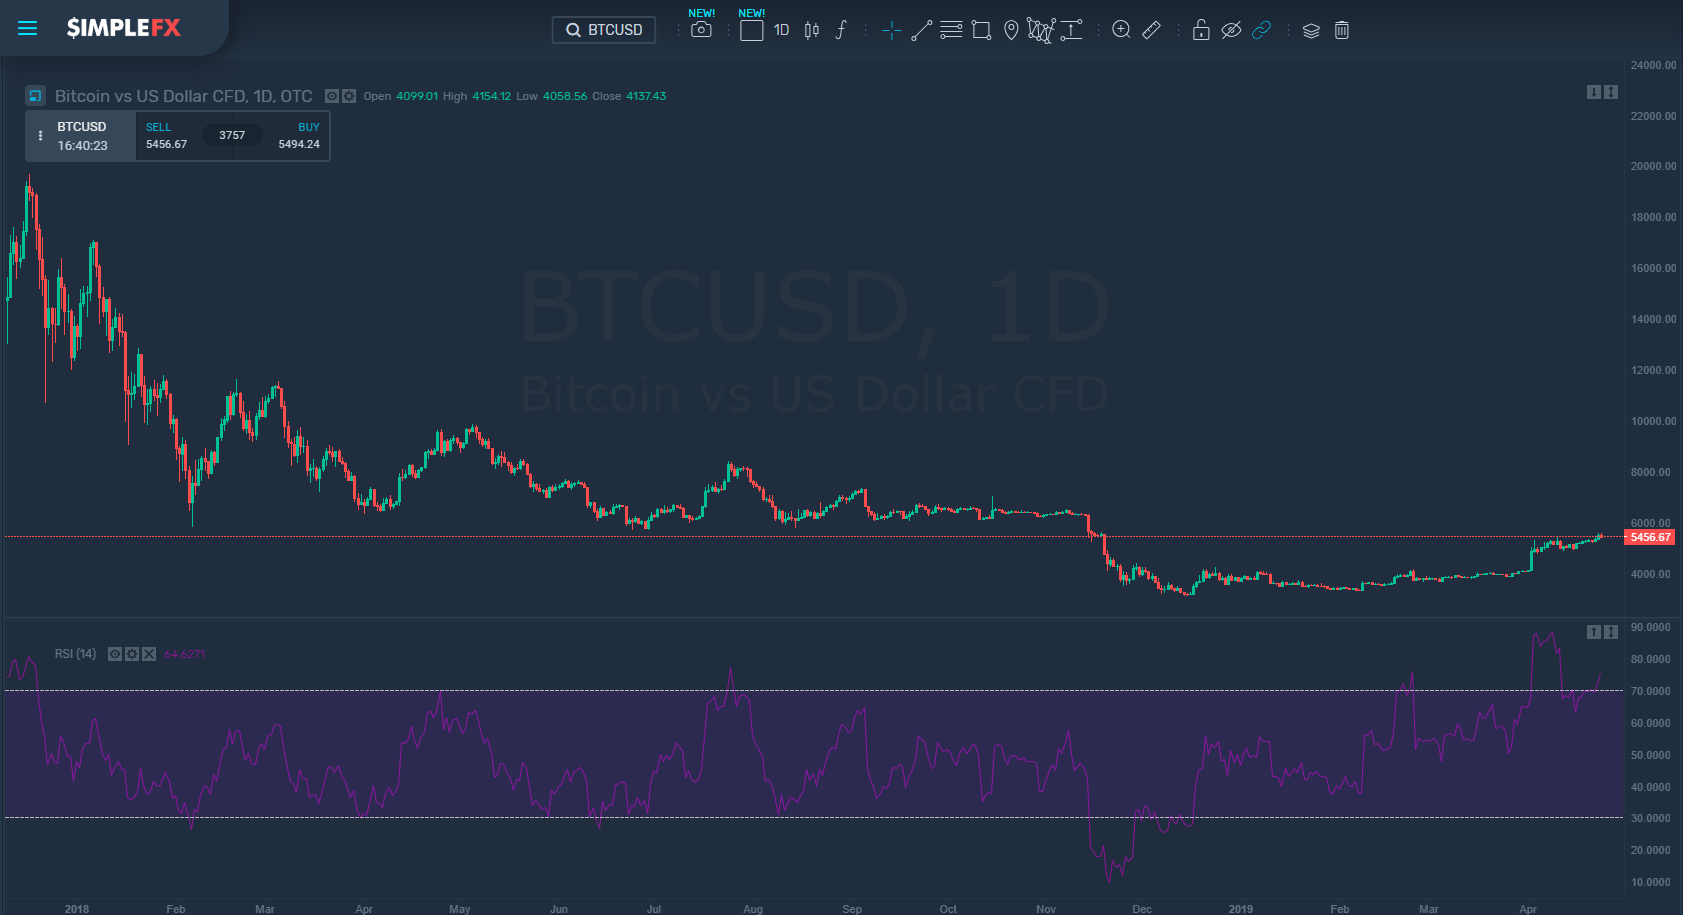
How does it work with the symbols you’d like to trade? You need to check it out on your own. Let’s take a look at the BTCUSD 1D chart.
You can see that at times the RSI was able to predict the trend, but at others, it gave away false signals.
Now, let’s take a look at AUDNZD in the last months. The RSI gave no strong signals in this period. However, it moved over 70 in April staying in “oversold” territory for a while.
For those of you, who would like to learn how it works with this Forex pair, I’d recommend following the AUDNZD in the next days with the RSI indicator turned on.
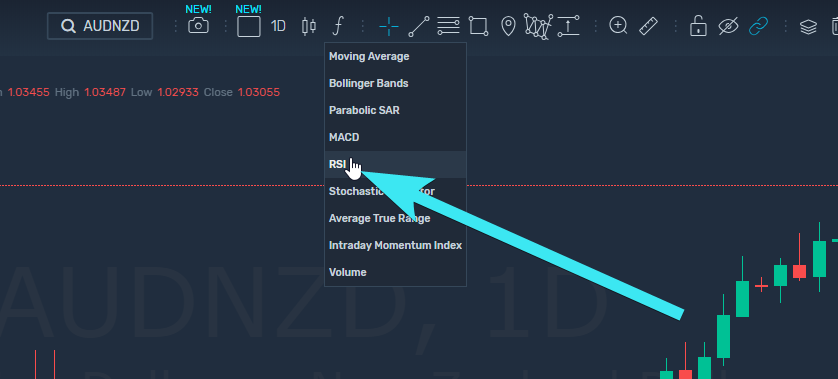
You can find it in the indicators section in the SimpleFX WebTrader toolbar.
Remember to try out your indicators on a DEMO account and see, how they work for you and your strategy, before trusting them when trading with a LIVE account.
Good luck trading!

