

You don’t need to study theoretical books in order to be a successful trader – buy at the lowest local price and sell at the highest. In fact, it all comes down to two skills you have to master by everyday practice:
- Reading charts
- Reading news
At a beginner’s level both these skills are quite easy, however, there’s plenty of room for mastery.
In this tutorial, we’ll deal with some very basics: how to read Japanese candlestick charts.
Japanese candles are the most useful and most common way of showing the price movement. They are so popular because they show some very useful trading signs. Reading candlesticks you can see the trends with no need to draw any additional technical analysis tools.
What are Japanese candles
Japanese candlesticks are made of vertical rectangles (called body) with lines at the bottom and top (called tails or shadows). The rectangle width is always the same – it represents the base period of the chart. For example on the BTCUSD 1M chart below each rectangle stands for 1 minute.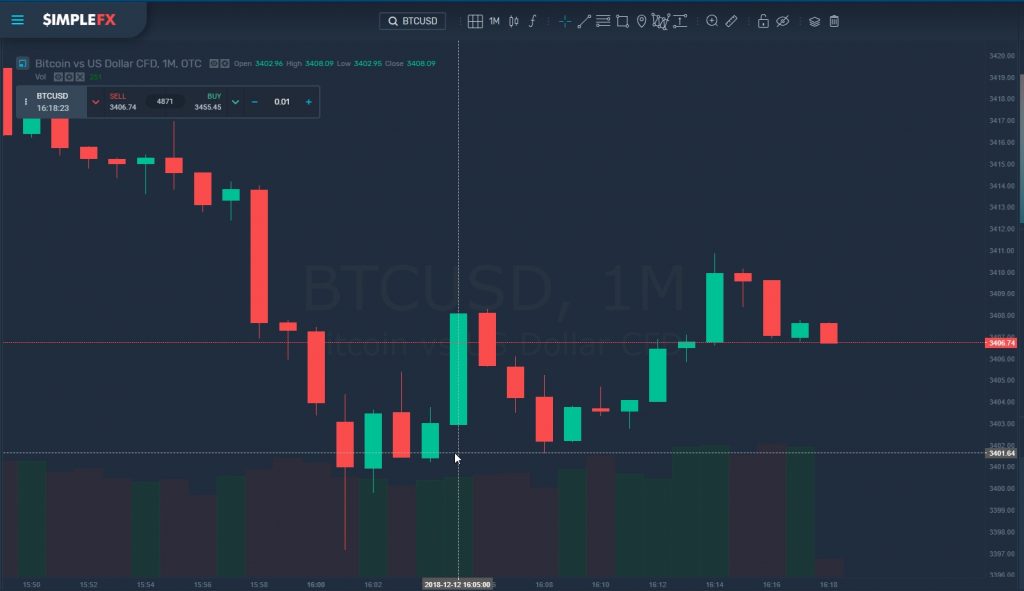
The height of the body represents the range for the open and close price for a specific time frame. Green candles mean that the closing price was higher than the opening price. Red candles say that the closing price was lower than the opening price. Red shows the price is going down, green – up.
The green candle marked on the chart above says that during on minute at16:05 Bitcoin opened at 3403 and closed at 3408.
The shadows represent the lowest and highest price in the interval. The green candlestick above has no tails which mean that the highest price was no bigger than the closing price and the lowest price was no lower than the opening price.
The lowest red candlestick has a very long bottom tail. It shows the lowest price Bitcoin was traded for in that period.
Japanese candlesticks are just perfect for spotting market turning points. An experienced eye can see the reversal patterns – the ones that imply the market could change direction.
Depending on the trend you can have bearish and bullish reversal signs. The bearish patterns are a call for a short order (sell) and bullish signs suggest you should make a long order (buy).
Bullish engulfing
You can see the sign at the 1H BTCUSD chart below.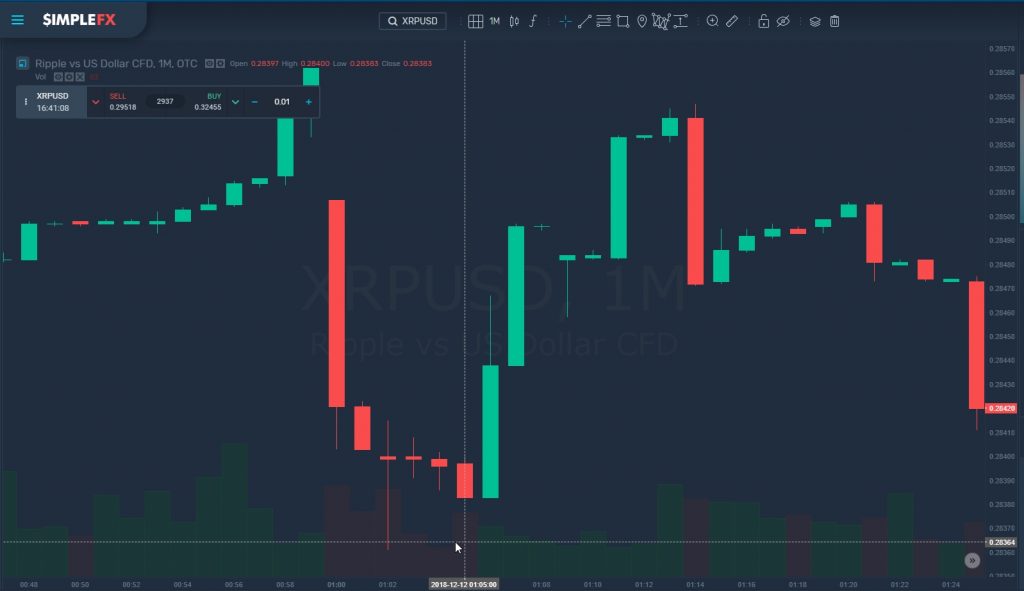
We have a downtrend with red candlesticks where after one red appeared a green candlestick that fully covers the previous red candlestick (XRP opened lower but closed higher than in the previous interval).
The signal above is very strong since the green candlestick is several times bigger that the red one preceding it.
Bearish engulfing
As you can see in the same chart, the uptrend indicated by bullish engulfing continues for 7 hours. Then a very tall red candle appears that fully engulfs the green candle. However, this time the candlestick pattern worked but not so smoothly, as the downtrend did happen, but only after 3 small retracements (rallies).
A hammer
This pattern is very easy to recognize. You just look at a green candle that looks like a hammer – has a short body and long lower shadow – four to five times as long as the body. Let me find one for you… Here you go: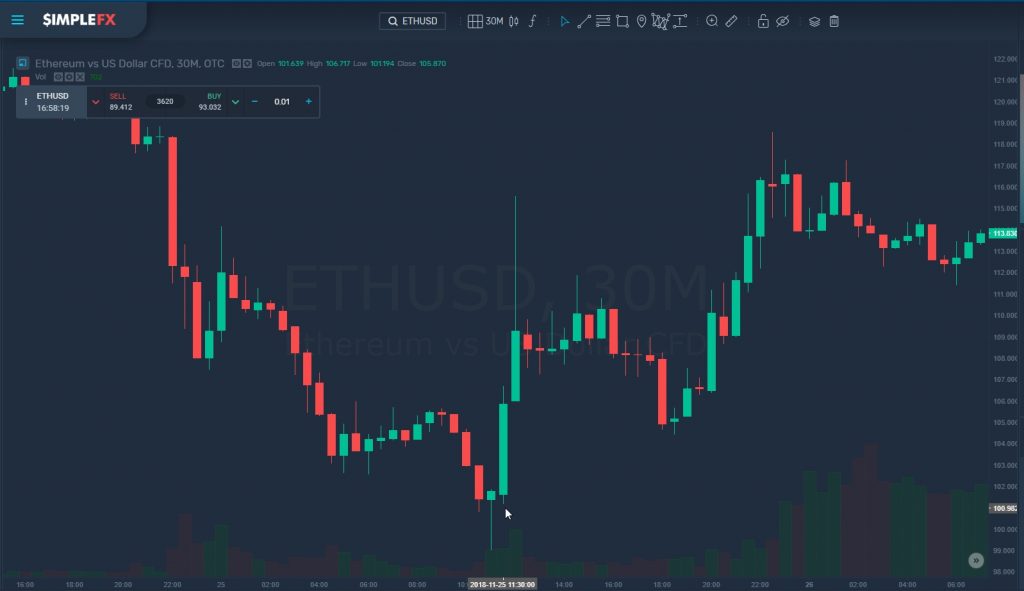
In this 30m ETHUSD chart, you can see a long downtrend with several retracements followed by a hammer that gave a strong sign of the upcoming market reversal.
Morning Doji Star
I will show you an example of Morning Doji Star pattern on a one-minute EURUSD chart (below). The pattern consists of three candles. First, we have an ordinary red candle, then the morning Doji Star – a red candlestick with a very short body and long shadows – which is then followed by a green candlestick.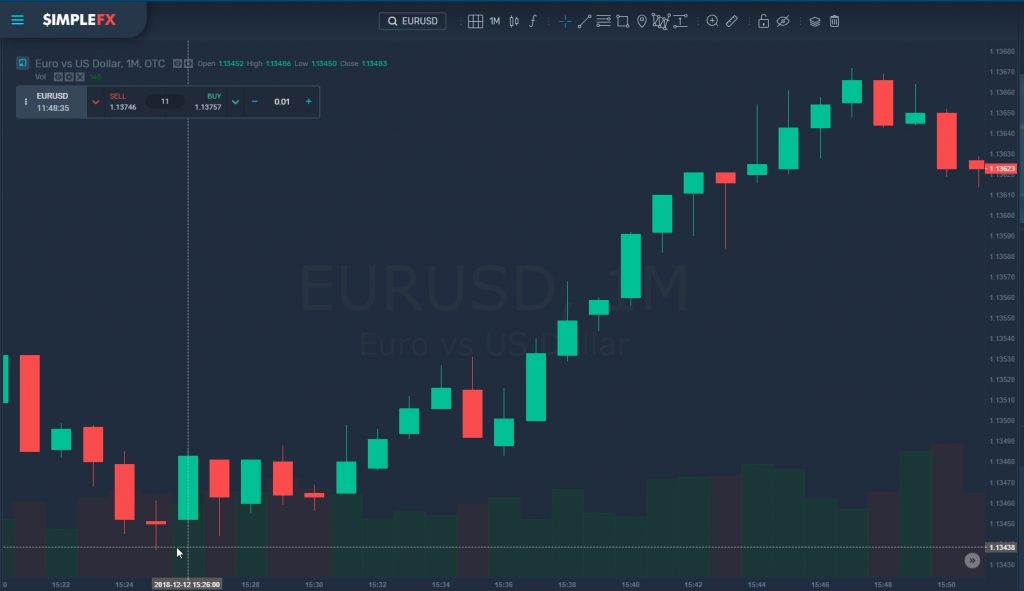
The signal is more powerful if the green candle next to the morning star is larger than the red one preceding it or closes above. We have both of this conditions met in the example above, that is why it should be understood as a strong buying flag. As you can see, it worked out in the next minutes.
Dark cloud cover
This is a bearish two-candle pattern. A green candlestick is followed by a red one that is higher but closes beneath the middle of the green candle. You may wait for the next candle to come for a confirmation – if a next candle shows a downtrend – you may consider taking a short position.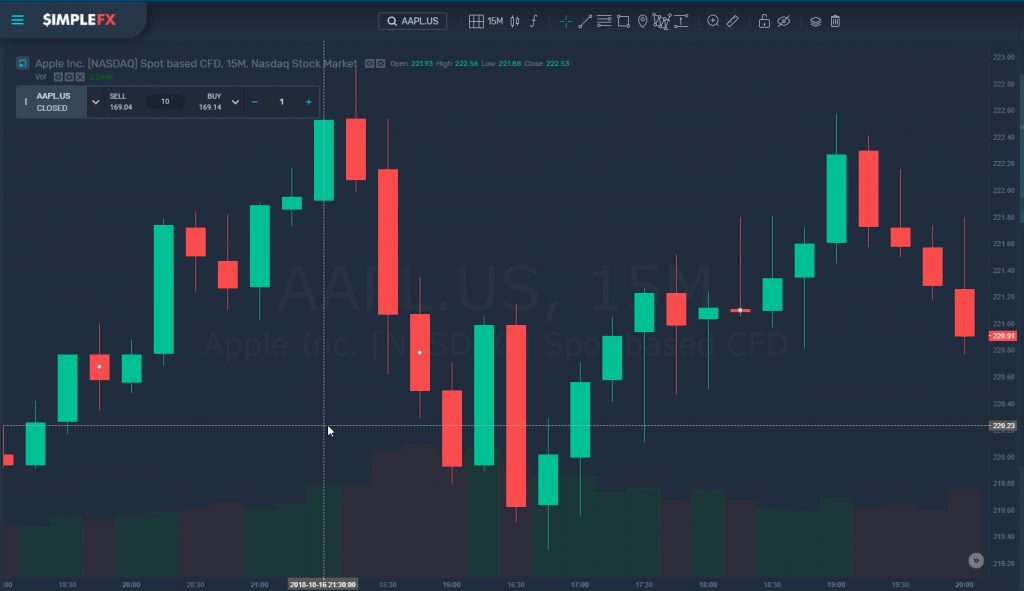
You can see two dark cloud cover signs in the 15M AAPL.US chart above. Both provide some handy signs for opening a short position.
A shooting star
If you see a shooting star at the and of an uptrend you can consider selling. A shooting star is a red candle with a short body and lower shadow, but a very long upper shadow.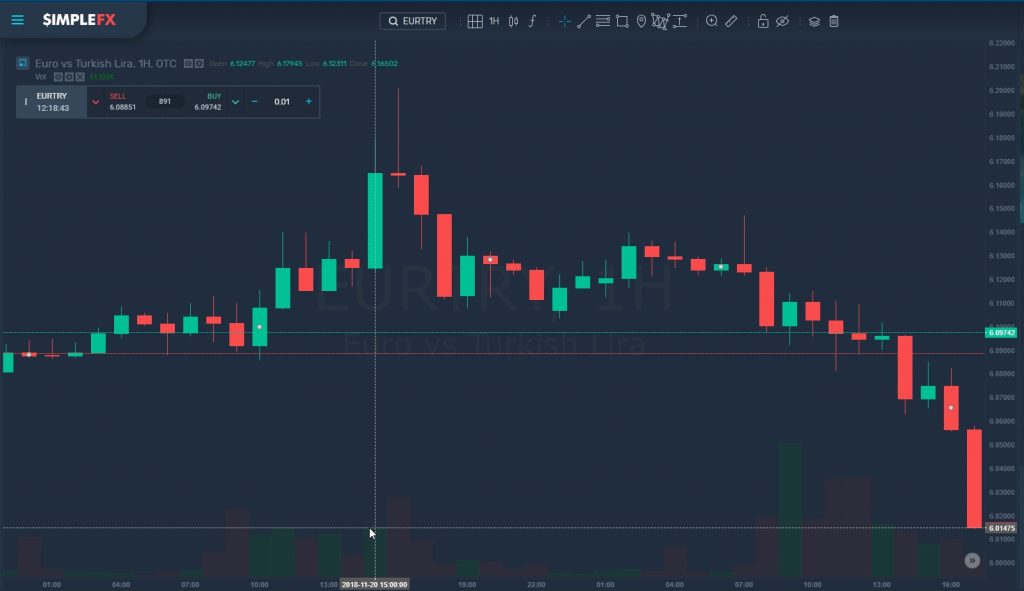
On the 1H EURTRY chart above you can see a shooting star signaling a local trend reversal.
As you can see the Japanese candlesticks are very easy in theory. You need to practice to make profitable trades using the patterns I discussed above. If you are new to trading, go to your DEMO account now, and try to come up with a winning strategy and execute it well. Only when you make some repetitive profit, move into live account increasing steadily your deposits.
Good luck with trading!